ACM Members Presenting at the 2023 AMS Annual Meeting
Published: December 27, 2022
Updated: December 30, 2022
Members of ACM are thought leaders and quite active in the meteorological community and within the American Meteorological Society (AMS). ACM is very proud of the engagement of its membership in the 2023 AMS Annual Meeting in Denver, Colorado. The AMS Annual Meeting is hybrid (in person and virtual) and runs January 8th to January 12th, 2023. Over 5,000 meteorologists, scientists and members of the weather, water, and climate enterprise plan to attend.
Thirteen members of ACM are presenting at the 2023 AMS Annual Meeting. They are involved in a day long short, one poster session, one research paper, and twelve research sessions. Below are ACM members presenting at the 2023 AMS Annual Meeting with date, time, title, and abstract. We also include our members teaching the ACM sponsored short course January 8th. To access all presentations, use this link. Links are provided below to the session of our ACM presenters.
To register for the 2023 AMS Annual Meeting click here. You can review our members and their areas of expertise on our Find an Expert Page.

Time and Date: 11:00am, January 11th, 2023
Abstract: Forensic meteorology is the study of past weather events, generally in the context of litigation. The foundation of a strong meteorological analysis and opinion in any forensic report is the data which is used for the analysis. Good data sources: use standard meteorological guidelines for siting instrumentation and taking measurements, are complete and without missing data, have been through quality control procedures, and are similar in elevation and in close proximity to an incident site. Additionally, NOAA certification is often needed for data to be admitted into court proceedings without question. It is rare that the actual data available fully meets all of these criteria.
The CoCoRaHS network is one dataset which meets many of these criteria and is heavily relied upon by forensic meteorologists. In addition, the detailed comments which are included by many observers are an invaluable resource when reconstructing past weather events. While daily precipitation, snowfall, and snow depth observations paint a partial picture of what the weather conditions were during or after a particular weather event, detailed comments contained in the CoCoRaHS reports can often help to give a clearer visual picture of what was on the ground during mixed precipitation events and during melting and refreezing periods following a snowstorm. This presentation will give an overview of how the CoCoRaHS network is routinely used in forensic meteorology and provide examples in which comments and descriptions given by observers were helpful in forming conclusions for specific cases.

Date and Time: 8:45am, January 11th, 2023
Title: 9A.2 - Analysis of Florida Insurance Claims to NOAA Storm Data Reports
Abstract: Florida accounts for 6.5% of the U.S. population. An April 2022 proclamation from the office of the Governor notes that Florida only accounts for 9% of the country’s home insurance claims, but it has 79% of the country’s home insurance lawsuits, and many of these lawsuits are fraudulent. Florida is a clear outlier among US states in the proportion of insurance claims that are litigated, and the Florida Office of Insurance Regulation has identified a number of legislative factors that incentivize claims-related litigation.
When a homeowner experiences a damaging weather event, they are more likely to call their insurance company than the National Weather Service to report the damage. The process in this study indicates that integrating anonymized insurance claims data with the NOAA Storm Data will provide a broader view of damaging events. Daily anonymized insurance claims data were analyzed from a 3rd party company that is a leader in insurance claims data collection and assessment. The event-specific analysis compares anonymized weather-related (wind, hail, tornado) insurance claims in Florida to NOAA Storm Data to identify consensus, outliers and potentially false claims. The events, put into graphical plots in a heat map representation for the various fields, show outliers and also areas where damage occurred that was not represented by a Storm Data entry. The inclusion of valid/quality-controlled claims data can identify areas impacted by damaging conditions that aren’t captured in the NWS LSRs, while the comparison of claims data with NWS data (storm reports, warnings, possibly radar and in-situ) can identify insurance claims that are potentially fraudulent.
THE HENRY T. HARRISON AWARD FOR OUTSTANDING CONTRIBUTIONS BY A CONSULTING METEOROLOGIST
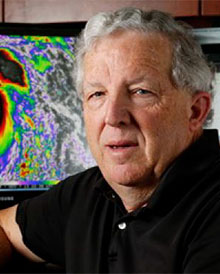
The American Meteorological Society recognizes Jan Null for a career of exemplary service as an AMS Certified Consulting Meteorologist and for his tireless work to raise public awareness on the issue of heatstroke deaths in vehicles.
Time and Date: 10:45am, January 11th , 2023
Title: 10.1 - Pediatric Vehicular Heatstroke: By the Numbers
Abstract: Since 1998 at least 924 children in the United States have died from Pediatric Vehicular Heatstroke (PVH) after being left unattended or having gained access on their own to a car, truck, van or SUV. To understand and ultimately prevent these tragedies, it is imperative to dissect the circumstances that led to a child being placed in these vulnerable positions.
This presentation will focus on the epidemiology of heatstroke deaths of children in vehicles, which have literally reached epidemic proportions. The data analyzed is intended to give other meteorologists, “station scientists”, child safety advocates, automakers, and other decision makers a statistical toolkit to use in developing more effective prevention campaigns. It will also address the role that technology may play in mitigating these tragedies.

Time and Date: 1:30pm, January 9th, 2023
Abstract: Florida accounts for 6.5% of the population, 9% of all homeowners’ property insurance claims, and 79% of all homeowners’ lawsuits against insurance companies in the U.S.
Florida is a clear outlier among U.S. states in the proportion of insurance claims that are litigated, and the financial burden of that litigation has become a severe strain on the Florida property insurance marketplace. Average homeowners’ insurance premiums have more than doubled over the past 3 years; several insurers have been declared insolvent; many more have stopped writing policies in Florida; and the financial stability rating of nearly two dozen Florida insurers has been threatened, with 3 ratings already downgraded or withdrawn.
Research from the Florida Office of Insurance Regulation (OIR) indicates that Florida insurers are not disproportionately denying claims, but rather that a disproportionate number of denied claims are being litigated. The OIR has identified a number of legislative factors that incentivize expensive claims-related litigation. However, the relative contributions of meteorological and non-meteorological factors to the initial filing of weather-related property insurance claims is an issue that remains uninvestigated not just in Florida, but across the U.S.
This deficit in knowledge of the drivers of weather-related property insurance claims is addressed by focusing on the Southeast U.S. and investigating the relationship between severe weather occurrence and weather-related property insurance claims.
We explore this relationship by comparing the frequency, seasonality, and severity of wind and hail events intense enough to cause property damage to the frequency, seasonality, and severity (cost) of property insurance claims in Florida and other coastal southeastern states that experience similar weather-related risks. The climatology of severe weather events is assessed via Storm Data (which are inherently population biased) and National Weather Service severe weather warnings (which are not). Property insurance claims data are provided by a 3rd party company that is a leader in insurance claims data collection and assessment.
In the absence of non-meteorological factors, we expect locations with more frequent and more intense severe weather events to have more and costlier weather-related (wind and hail) insurance claims. Where that is not case – where, for example, milder weather is associated with a higher proportion of insurance claims – we know that other factors (e.g. population, differences in building codes, and legislative/policy incentives) are at play.
As the Florida property insurance marketplace totters precariously forward, burdened with high litigation costs while operating in a state prone to catastrophic weather events, the authors hope this research can inform a data-driven approach toward market reform that addresses both the meteorological and non-meteorological factors that drive property insurance claims.

Time and Date: Poster session the afternoon of January 9th, 2023
Title: Poster 100 - New Wind Gust Record for Georgia Based on Mesonet Observations
Poster Session Abstract: On April 5, 2022, a severe storm caused significant damage to a University of Georgia mesonet station located near Byromville, GA. At the time of the event, the Byromville station recorded a wind gust of 129 miles per hour (57.7 m/s) before the station signal was lost. While the station was severely damaged, the cup anemometer was found to be still attached to the station tripod and rotating freely, although the directional was missing. Based on the inspection of the station and the instrument, the reading was classified as accurate. A subsequent inspection of the station and surrounding damage path determined that it was directly impacted by a tornado that was rated as an EF-2 by National Weather Service storm surveyors based on the wind measurement along with nearby property damage. A query of the UGA weather network database identified this as the highest wind gust measured at any of their sites in the 30-year history of the network. An analysis of other wind databases is underway to determine if this is the record highest wind gust in Georgia. If, as expected, this is a new gust record for the state, a State Climate Extremes Committee will be convened to get this record wind gust recognized as the highest wind gust ever recorded in Georgia. The state currently does not have an official state wind gust record. Other high wind gust reports will also be reviewed for comparison.

Chair: 23rd Aviation, Range and Aerospace Meteorology (ARAM) Conference
Time and Date: 8:30am Monday, January 9th, 2023
Title: 1B.2 - Federal Aviation Administration Service Update
Abstract: The Federal Aviation Administration (FAA) is the United States Meteorological Authority for Aviation to the United Nations International Civil Aviation Organization. As such, the FAA establishes policy, procedures, and requirements for aviation weather information within the United States National Airspace System (NAS). This presentation will highlight the ongoing efforts over the last year from those organizations within the FAA that research, produce, or consume weather information in support of maintaining a safe and efficient NAS and take a look at plans for the future of aviation weather over the next 15 years.
Time and Date: 10:45am January 9th, 2023
Title: Session 2 - Efforts to Reduce the Number of Aviation Accidents
Abstract: From 2009 to 2017, the annual number of weather-related General Aviation (GA) accidents was reduced from 65 to 42 with the number of fatalities decreasing from 47 to 32 as a result of advances in weather forecasting and the accessibility of weather information in the cockpit. Despite these improvements, in 2017, weather was a contributing factor in 35% of all GA accidents with 75% of these accidents having fatalities. Still, the reduction of accidents and fatalities is a success story.
This session is seeking presentations on weather research, novel technologies and operational proficiencies that have contributed to the reduction in GA accidents. This may include capabilities to improve weather observing and forecasting, translation of weather information, and communication of data to the cockpit.
Time and Date: 11:00am January 11th, 2023
Title: Panel Discussion10A.2 - User Needs of NOAA Products and Services for Aviation
Abstract: The Federal Aviation Administration (FAA), and the entire aviation enterprise, rely on data and products from NOAA to safely and efficiently conduct operations. The FAA’s Aviation Weather Division (AWD) develops requirements, conducts research, and transitions successful research capabilities to the National Weather Service for use into services and decision support systems. AWD funds and manages a variety of research programs related to convection, turbulence, in-flight icing, ceiling and visibility, wind, and other phenomena that impact aviation safety and efficiency, as well as development of minimum weather standards and initiatives to get critical weather data to the cockpit. Candidate algorithms and products resulting from this research undergo a rigorous quality assessment to determine meteorological accuracy and a comprehensive user evaluation process to measure operational effectiveness. Only successful projects are transitioned to formal operational status for use by air traffic controllers, planners, aviators, and other decision makers.
This presentation will be part of a planned panel session to provide highlights on how the FAA is using or planning to use NOAA data to improve weather support to aviation. The information presented in this panel session will inform attendees about FAA research efforts and provide NOAA with feedback on their products and services leveraged by the FAA. The benefit to these products and the implications for aviation will also be discussed.

Time and Date: 9:45am January 9th, 2023
Abstract: There has been much research on ammonia (NH3) bi-directional fluxes in agricultural and forest ecosystems. Typical atmospheric NH3 concentrations, which are due mainly to natural and agricultural sources, are observed to have a maximum of about 100 ppb near the surface. However, across the world, there is widespread storage and transport of many tons of anhydrous NH3 in pressurized (up to 13 atmospheres) or refrigerated (below the boiling point of -33°C) tanks. Previous field experiments of NH3 releases from 1 to 37 tons indicate concentrations exceeding 10,000 ppm at distances less than about 100 m, and 1000 ppm out to distances of a few km. These concentrations are several orders of magnitude greater than those typical of air pollution. When released from a hole in a pressurized tank, the liquid NH3 flashes, with about 20 % of the mass in the gas phase and 80 % in the liquid phase (in the form of aerosols with diameters of about 50 microns or less). Some of the liquid settles on the surface near the source, forming a liquid pool or penetrating into the soil or other material, and most of this re-evaporates over several minutes.
A major difference found between air pollution and accidental releases is that, at high concentrations, there may be so much deposition that the surface becomes saturated and subsequent deposition is inhibited. Our team has used laboratory chamber experiments to show that saturation happens for chlorine at concentrations exceeding a few hundred ppm for various vegetation and surface types.
The Jack Rabbit 3 (JR3) field and laboratory experiments, to be carried out over the next four years, are intended to provide detailed observations of NH3 transport, dispersion and deposition over a variety of land and material surfaces. Chemical reactions on and below the soil surface and other materials will be studied. This paper gives an overview of the main technical challenges and knowledge gaps and describes the current and planned deposition and surface chemical reactivity studies.
Laboratory studies, small-scale field studies, and full-scale field experiments will take place during JR3. Laboratory studies have begun and are investigating uptake of NH3 by various substrates and vegetation. Because several knowledge gaps concern effects of substrate types and vegetation on transport, dispersion, and deposition, small-scale field studies (with small to moderate releases) are planned for vegetated sites. Full-scale field studies, with releases of 5 to 20 tons from pipe ruptures, are planned, with deposition and surface chemical reactivity measured by setting out small plots with soil and vegetation, plus setting out small amounts of various materials such as asphalt pavement and commonly-used metals.
Time and Date: 8:45am January 10th, 2023
Title: 5.2 - A Lagrangian Particle Model and Studies on the Role of Mesoscale Low Level Jets and Data Assimilation in Plume Spread
Abstract: Pollutant plume spread and transport have been important topics in air pollution and nuclear releases. Roger Pielke Sr.’s students and collaborators developed a Lagrangian particle model (LPM) coupled to a mesoscale meteorological model to study the growth of pollutant plumes as PBL turbulence interacted with mesoscale atmospheric circulations. Over the years, Roger supported this tool through funding and applications across topics from transport in sea breezes in Florida and Israel, to mountain valley circulations to mesoscale low level jets. Dozens of publications by Roger, his students and collaborators have resulted from this tool. This presentation discusses the background of the LPM and the role that mesoscale temporal energy in the form of the low-level jet (LLJ) plays in plume dispersion.
Boundary layer theory suggests plume width should grow at a rate proportional to travel time near the source but then slow to the square root of time as the plume grows to the size of the turbulent eddies. However, in the 1970’s long-range observations showed that plumes continued to grow at a rate proportional to travel time or even greater over long distances. There was debate among pioneers in plume dispersion on what sustained this growth, with Frank Gifford arguing that the cause was mesoscale energy and Barry Smith arguing that it was due to vertical wind shear. To address this debate, McNider et al. 1988 carried out a modeling study of Australian smelter plumes that had been observed for long distances against the clean Southern Hemisphere background. The initial LPM was described including the parameterization of the particle turbulent velocities from boundary layer theory (Hanna 1979), and a series of numerical simulations was carried out to replicate the behavior of the Australian smelter plumes.
These simulations showed that vertical shear overnight, due to the LLJ, distorted the plume producing a very wide plume. Pasquill 1962, perhaps, first recognized the importance of initial shear distortion and subsequent vertical mixing for medium range dispersion. The formation of the LLJ and thermal wind shear from observations produced plume widths which were largely in agreement with the smelter plume observations. It was concluded that shear sustained the plume growth, but the shear was largely produced by mesoscale temporal energy in the inertial range as the LLJ developed. Thus, both Gifford and Smith were partly correct. The presentation will review this study.
After this initial study of the role of LLJ in sustaining plume growth, other follow-on LLJ studies using the LPM looked at the role of latitude in maintaining plume spread, the transport and spread of urban plumes overnight and the behavior of power plant plumes and inert tracer plumes over long distances. Of particular interest were simulations of low level of tracer experiments over the Great Plains. Here the LLJ can be accentuated by the gradual slope of topography. Moran and Pielke 1996 showed that the LLJ greatly impacted plume transport and plume spread. Only models that included the LLJ correctly captured transport time and spread. These results will be presented.
In air pollution meteorology, it came to be generally recognized that the LLJ was often the dominant mechanism in exporting pollutants, especially NOx, from urban areas and distributing these pollutants into the rural environment under the general light wind conditions associated with air pollution events. The presentation will review these LLJ/plume studies.
Modelers felt comfortable knowing that mesoscale models generally had the correct PBL physics to produce realistic LLJs. However, it turns out that another modeling aspect, data assimilation, often removed the LLJ without being detected. Data assimilation, as carried out in the largely retrospective modeling studies used for air pollution management and policy development, is important to keep the model forecast on track. However, most of the observations employed in data assimilation are based on rawinsonde analyses at 00UTC and 12UTC and do not capture the LLJ in the U.S. which develops overnight. It was found that nudging strategies employed in air quality modeling can remove the LLJ the model is trying to develop. These recent examples and new recommended data assimilation strategies will be covered in the presentation.
References:
Hanna, S.R., 1979. Some statistics of Lagrangian and Eulerian wind fluctuations. Journal of Applied Meteorology and Climatology, 18(4), pp.518-525.
McNider, R.T., Moran, M.D. and Pielke, R.A., 1988. Influence of diurnal and inertial boundary-layer oscillations on long-range dispersion. Atmospheric Environment (1967), 22(11), pp.2445-2462.
Moran, M.D. and R.A. Pielke, 1996b: Evaluation of a mesoscale atmospheric dispersion modeling system with observations from the 1980 Great Plains mesoscale tracer experiment. Part II: Dispersion simulations. J. Appl. Meteor., 35, 308-329.
Pasquill, F., 1962. Some observed properties of medium‐scale diffusion in the atmosphere. Quarterly Journal of the Royal Meteorological Society, 88(375), pp.70-79.

Time and Date: 11:15am January 10th, 2023
Abstract: Forecasting a Continuum of Environmental Threats (FACETs) represents a fundamental change in the dissemination and communication of hazardous weather information. Instead of deterministic warnings that are static and updated at specific intervals, the FACETs paradigm creates the potential to communicate threat uncertainty through a continuously-updating flow of information. This could provide more equitable hazard-warning lead times while also providing additional information about hazard timing, location, intensity, and evolution.
Through a series of experiments in the NOAA Hazardous Weather Testbed (HWT), various forms of forecaster warning-decision-making processes and communication have been tested: from traditional legacy warnings, to probabilistic hazard information (PHI) used as guidance for the issuance of legacy warnings, to continuously-updating threats-in-motion (TIM) that follow the hazard in one-minute increments between forecaster decisions. It is critically important to analyze this new warning paradigm compared to current operational methods to determine any value-added benefits for forecasters, end users, and the public so that further research, development, and best practices can address these items to ensure that future warnings communicate and disseminate risk properly.
This study compares PHI, TIM, and legacy warnings issued by NWS forecasters during multiple Experimental Warning Program HWT experiments. These experiments simulated NWS operations through both archived and real-time weather scenarios where forecasters used operational software as well as web-based tools to issue these warning products. Simulated Impact-Based Decision Support Services (IDSS) and communication exercises with emergency managers and other end users further simulated the operational environment and examined communication and collaboration strategies. Following each experiment scenario, surveys and discussions captured forecaster feedback regarding scenario-specific information and more holistic thoughts on the new paradigm. Forecaster warning-decisions, workload, and task management were investigated to better understand the physical and mental load of the experimental products and decisions compared to the current paradigm.
Overall, warnings that continuously followed the hazard provided increased average lead times, provided more equitable lead times, and created the ability to communicate departure “all clear” messages to the public and other end users sooner compared to legacy warnings. For forecasters, PHI was able to inform their warning decisions, increase their confidence regarding storm severity, and provide situational awareness during warning operations. Workload levels varied among the three warning methods related to the number of PHI objects or warnings belonging to a forecaster as well as the software constraints for the issuance of objects and warnings. Multiple forecasters noted a steep learning curve with higher initial workloads and gradually decreasing across the week until they were comfortable with the new technology. While PHI-based information still requires additional testing with end users and the public for dissemination purposes, these experiments and anecdotal evidence from NWS offices using these types of public-facing graphics have illustrated the usefulness of PHI to bridge the gap between watches and warnings as well as communicate increasing (or decreasing) threat areas more so than the current paradigm.

Time and Date: 8:30am January 9th, 2023
Title: 1C.1 - Monitoring and Modeling of Irrigation for Improved Weather Prediction
Abstract: Irrigation is an anthropogenic activity that can enable crops to thrive in dry, non-native regions, or it can supplement soil moisture to increase yield in more humid regions. This land cover modification not only affects soil moisture and vegetation, but also surface fluxes, planetary boundary layer development, and potentially clouds and precipitation. For this reason, it is important to 1) estimate where, when, and how much irrigation water is used for agriculture, and 2) use this and other information to model irrigation and its impact in our weather and climate models. This talk will describe recent work in which NASA satellite data and models have played an essential role in the monitoring and modeling of irrigation, and in doing so, have helped advance our understanding of human water management impacts on the Earth system.
Time and Date: 9:30am January 10th, 2023
Abstract: Anthropogenic modifications to the terrestrial water cycle, such as irrigation abstraction and application, can affect land-atmosphere interactions and local to regional weather. A necessary step in accurately representing such processes in coupled models is to define where, when, and how much irrigation occurs spatially. This information is typically defined using spatial maps of irrigated areas. Recent advancements in irrigation mapping enabled by improved remote sensing and data processing technology have yielded higher resolution (in both time and space) irrigation information. This study uses a suite of offline and coupled simulations using NASA’s Land Information System (LIS) and NASA’s Unified Weather Research and Forecasting (NU-WRF) system to investigate the impact of irrigation induced heterogeneity of varying scales on land-atmosphere interactions in eastern Nebraska. In particular, the impacts of irrigation map resolution on land surface heterogeneity and subsequent impacts on land-atmosphere coupling are explored during the NSF-funded Great Plains Irrigation Experiment (GRAINEX) Field Campaign in 2018.
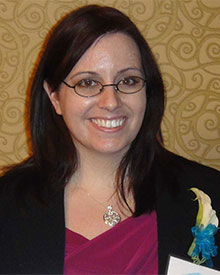
Time and Date: 4:45pm January 9th, 2023
Title: 4.5 - Enriching K-12 Education Using Accessible Versions of a Weather Model
Abstract: Evolving technology allows us to run weather models like never before. What once required a tedious installation now can be accessed with a few commands, making it easier than ever to explore real-world atmospheric phenomena. An understanding of atmospheric science increases science literacy and appreciation of the natural world, and learning through real-world exploration helps students connect with concepts they learn in the classroom. To broaden the impact, these enhancements can be applied at the K-12 education level to promote interactive and impactful learning according to the curriculum. For younger students, this is crucial in developing critical thinking skills, problem solving, and sparking interest in the Weather, Water, and Climate Enterprise. For older students, this type of interactive technology will prime them for higher education and potential careers in STEM. Working with weather models has the added bonus of exposing students of all levels to basic computer programming, data analysis, and data visualization. These skills are essential for our future workforce, as computer technology has become more advanced and ubiquitous in most industries and careers.
M2Lab.org, in collaboration with Yarker Consulting, is in the beginning stages of designing and testing two configurations of the Weather Research and Forecasting Model (WRF) for education (e-WRF). This provides all students the opportunity to explore their environment–past, present, and future–using a real regional atmospheric computer model. e-WRF is a complete version of WRF that has been fully compiled and can be accessed virtually using either Docker Desktop or Amazon WorkSpaces. It contains everything required to test the installation quickly and to run an experiment, from the files that define the simulation, to the input data that the model ingests, to the capability to save results for later use. In addition to data analysis, students can use e-WRF to visualize concepts that comprise an entire education unit, such as the greenhouse effect or cloud formation. It can be run on almost any device and operating system, which makes it accessible to a variety of students, teachers, and schools.
To make e-WRF a true “one-stop shop” for all WRF modeling resources, a database of easily accessible input data and data visualization tools still needs to be developed. The input data will include additional sample files that define experiment variables for the model and geophysical data that the model will read. The data visualization tools will include sample scripts to create maps, time series plots, and statistical analyses. With this database, students and teachers can choose their level of involvement. This could be as simple as running a ready-made simulation to illustrate a concept in class or as advanced as editing parameters and data to create an individual experiment. The goal is to put weather modeling into the hands of today’s students, meeting them where they are, to benefit them into the future.
Time and Date: 3:45pm January 10th, 2023
Title: Co-Chairing Session: Joint Session J8 - Acquiring Certifications and Enhancing Skill Sets through Professional Development and Adult Learning Opportunities
Short Course Presenters

Dr. Alicia C. Wasula, Ph.D., CCM

Dr. Charles H. Paxton, Ph.D., CCM

Dr. Morgan B. Yarker, Ph.D., CCM

Stephen (Steve) W. Harned, CCM

Randy Bass, CCM

Rick Shema, CCM

Mark McGinnis, CCM
Time and Date: 9:00am to 3:45pm January 8th, 2023
Short Course: Meteorological Tools, Processes, and Techniques Used in Private Business
Course Description: Participants will leave knowing the methods to verify data and the accepted methods of data interpolation and extrapolation. Participants will also walk away with a detailed list of what concerns business owners encounter in the standard operation of their business, and approaches and methods which have proven successful for CCMs who run their own businesses. To assist participants in retaining and referencing this information, a list of references and materials used in the course will be handed out.

