Click ► Arrow to Open Question | Click ▼ Arrow to Close Answer
The difference between a tropical depression, a tropical storm and a hurricane depend on their wind speeds and barometric pressure. A tropical depression is a tropical weather system with sustained maximum surface winds of 39 MPH or less. A tropical storm is a tropical weather system with sustained maximum surface winds between 39-73 MPH. Once a tropical storm forms, it is a given a name. A hurricane, or typhoon, must have maximum sustained surface wind speeds reaching 74 MPH or greater.
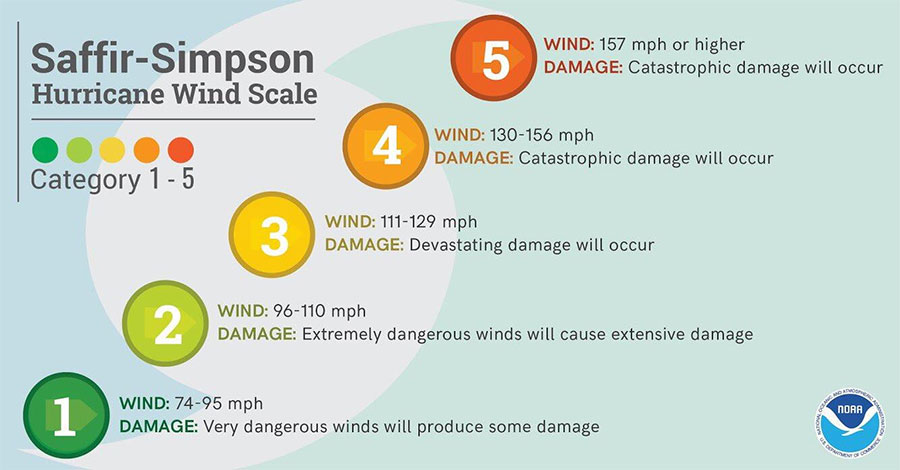
Hurricanes can be classified into 5 categories, also ranked by wind speed, called the Saffir-Simpson scale. Hurricanes that are category 3 or higher are known as major hurricanes. In the image below characterizations of expected damage are provided with each category of hurricane.
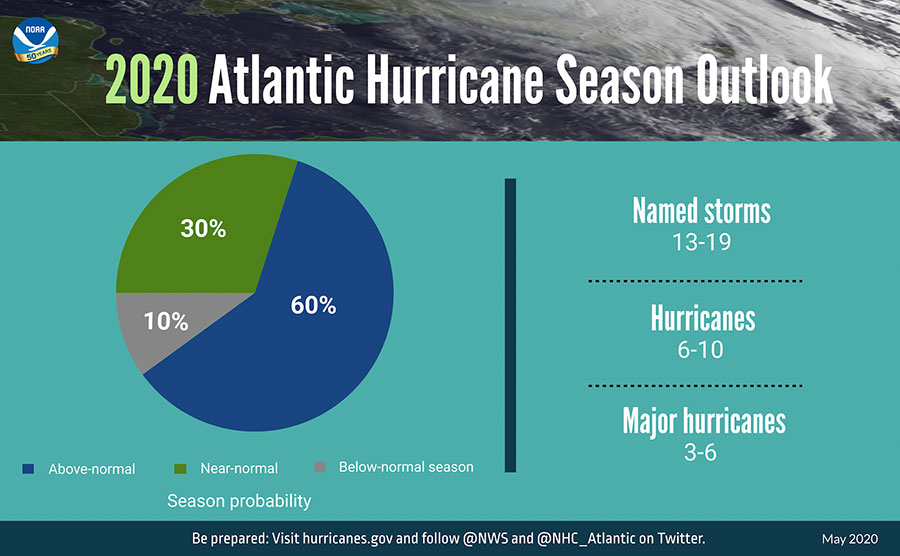
Atlantic hurricane season officially runs from June 1st to November 30th every year. however, it is not completely out of the question for tropical cyclones to form outside of that time period. In the eastern Pacific, the timeline is slightly longer, running from May 15th to November 30th. The National Hurricane Center (NHC) releases an outlook in early to mid-May with an approximation of how many tropical storms and hurricanes will develop in the upcoming season. Figure 1 is the NHC outlook from May 21, 2020 showing the prediction for the number of named storms, hurricanes, and major hurricanes during the then upcoming 2020 Atlantic hurricane season. There was a 60% chance of the season being above-normal for activity.
The earliest storm to develop in the Atlantic basin was January 3, 1938, with the formation of an unnamed Category 1 hurricane which lasted until January 6, 1938. The latest storm to develop in a calendar year was in 2005, when Tropical Storm Zeta formed in the Atlantic on December 30, 2005 and did not dissipate until January 7, 2006. It is one of two named storms, in the Atlantic basin, to exist over two calendar years.
The 2020 season, with 31 total storms, ended up exceeding scientist’s predictions and became the most active season in modern history since records began in 1851, surpassing old record of 30 storms during the 2005 season.
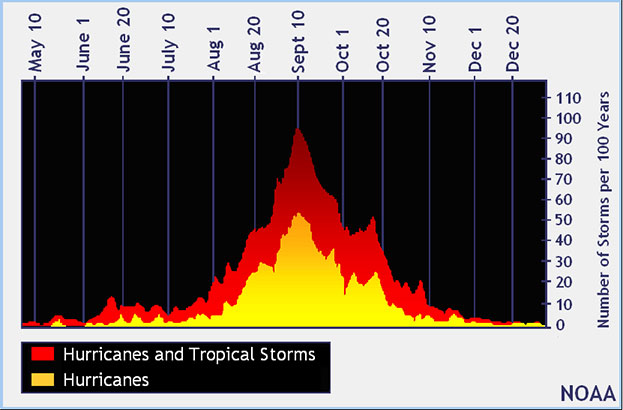
The most active months of hurricane season are August through October, with September 10 marking the peak. Figure 2 is a chart from the NHC showing the distribution of tropical storms and hurricanes for given dates during Atlantic hurricane season per 100 years. December through May are the least active months.
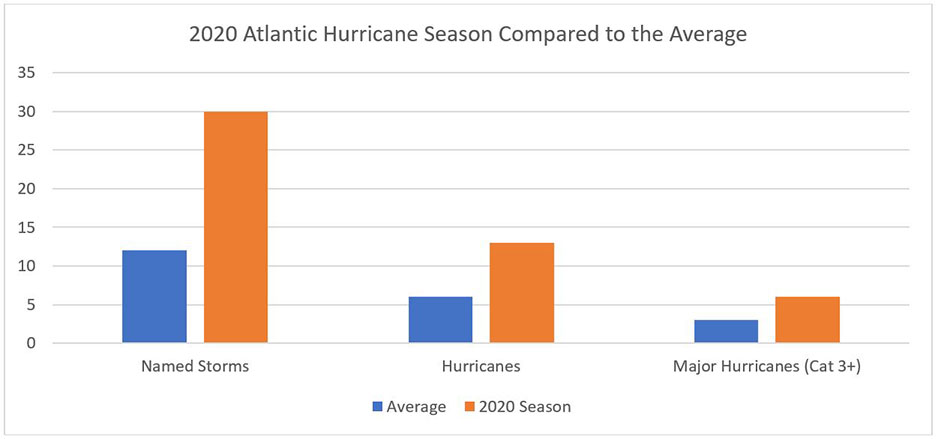
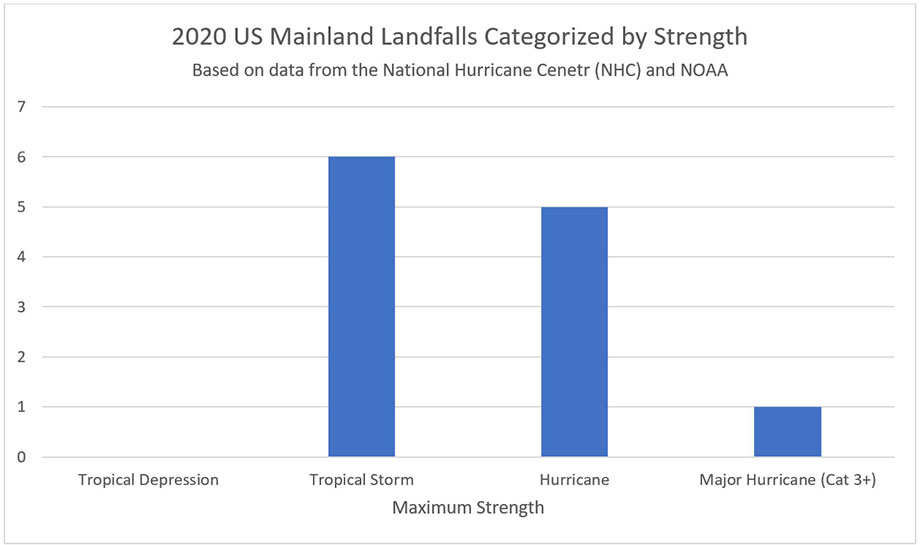
The 2020 Atlantic Hurricane season was the most active season since record keeping began in 1851, surpassing the 2005 season. In 2020, there were 31 storms that formed during the season that reached at tropical depression status. 30 of them became tropical (named) storms, and out of those 13 became hurricanes, with 6 of them intensifying into major hurricanes of category 3 status or higher. For reference, an average season has 12 named storms, six hurricanes, and three major hurricanes (category 3+), according to the National Hurricane Center (NHC).
There were also so many named storms in 2020, that the NHC ran out of names from their pre-determined 21 name list, instead resorting to using letters of the Greek Alphabet to name the remaining storms. This had only happened once, back in 2005. The last storm to form during the season, Hurricane Iota, strengthened rapidly to a Category 5 in mid-November, becoming the latest storm in history to do so.
To learn more about the 2020 Atlantic hurricane season click here.
Figure 4 is from the National Weather Service and the US Department of Commerce shows the preliminary tracks of all 31 storms (30 named storms and one depression) in the 2020 season, as well as their intensities. While some remained in the Atlantic and never threatened land, several had an impact in the Caribbean, United States and Canada. The box in the lower left shows the track of all 5 storms that made landfall in Louisiana.
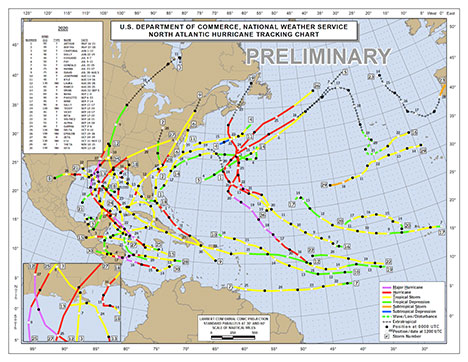
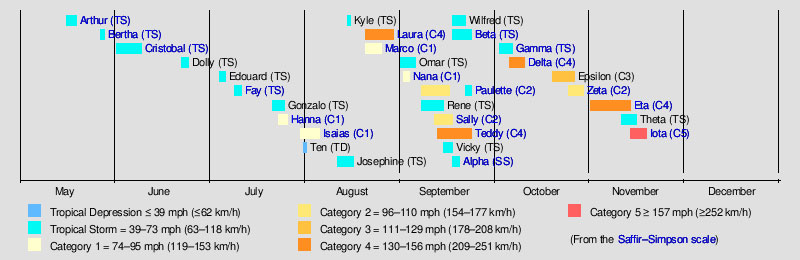
Figure 5 is a chart of the 2020 Atlantic season Wikipedia page showing how the storms were distributed starting in May 2020 through November 2020. There were 11 storms in just the month of September. In fact, Wilfred, Alpha, and Beta all formed on the same day, September 18th, tying the record for the most storms formed in one day in the Atlantic.
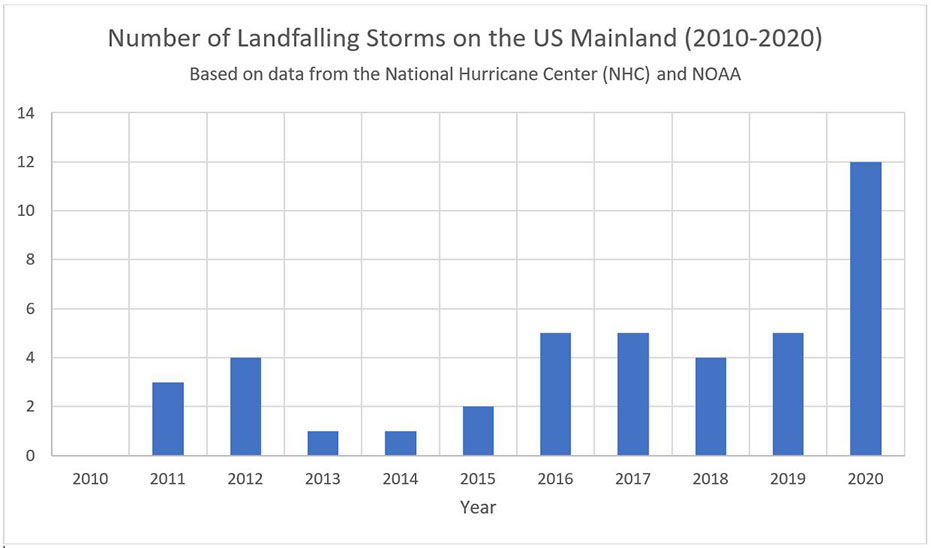
2020 was a record-breaking year for the Atlantic hurricane season. 2020 became the year with the most tropical depressions on record at 31. 12 of the named storms made landfall in the continental United States. Of the 6 storms that intensified and made landfall as hurricanes, 5 of them made landfall in Louisiana, including Category 4 Hurricane Laura on August 27th, which became the strongest storm to make landfall in Louisiana since 1856. For comparison, according to NOAA, between 1-2 hurricanes hit the US every year, with an average of 1.62, annually.
Between 2016-2019, there were 4-5 landfalls per Atlantic hurricane season according to the National Hurricane Center. Then, the 2020 season more than doubled with 12 landfalls – a record amount for one year. The previous record for most US landfalls in a single season was 9 in 1916.
The 2020 Atlantic hurricane season was record breaking and impactful. There were 431 fatalities, and over $50 billion in damage from the 31 storms (not all storms created damages or fatalities). Many of the fatalities were due to storm surge and flooding, which is the number one killer during a hurricane or tropical storm. Many communities along the Gulf Coast of the United States, especially in Louisiana, continue to recover and rebuild from the 2020 Atlantic hurricane season.
If you are interested in learning more about landfalling hurricanes, visit the link below to look at landfall for any named storm in a NOAA database of 13,000+ storms dating back to 1842: NOAA Gov
Click ► Arrow to Open Question | Click ▼ Arrow to Close Answer
A blizzard is a type of severe winter weather event. Contrary to popular belief, snow is not the only criteria necessary for a weather event to be classified as a blizzard. To be considered a blizzard, per the NWS, BOTH of the following criteria must be met for three hours or more:
In actuality, there are blizzards with no falling snow. In instances with no falling snow, the reduced visibility results from winds in excess of 35mph picking up and blowing snow for three hours, or more. To summarize, blizzard conditions are the result of lowered visibility from falling, or blowing snow, combined with winds in excess of 35mph and these conditions occur for 3 or more successive hours.
The National Weather Service defines the dew point as the temperature that the air needs to be cooled to achieve saturation. Simply speaking, it is the temperature at which dew forms or water droplets condense into dew. These water droplets that have reached saturation can condense both in the air or on a surface, such as vegetation.
Dew point and relative humidity are closely related, since relative humidity is a variable derived from the measurements of temperature and dew point. Relative humidity shows the percentage of water in the air based on the temperature. Since warmer temperatures (or warmer air parcels) hold more water than colder temperatures, relative humidity can be misleading to the public. Dew point shows the amount of moisture in the air. The higher the dew point, the more moisture is in the air. The closer the temperature is to the dew point, the more humid it is. When the dew point and temperature are equal, the relative humidity is 100%.
To find out more information from the National Weather Service, click here
The reason why the sky is blue is based upon the concept of visible light refracting when it passes through the Earth’s atmosphere. This is called Rayleigh scattering. The sun’s light is transmitted through space in all colors. However, when it reaches our atmosphere, the light is scattered and separated out into individual colors. Purple and blue colors scatter the most and that is the color we see when looking at the sky. However, at sunrise and sunset, when visible light passes through thicker portions of the Earth’s atmosphere, shorter wavelength light such as orange and red scatter more and are more visible. The National Weather Service has more information here.
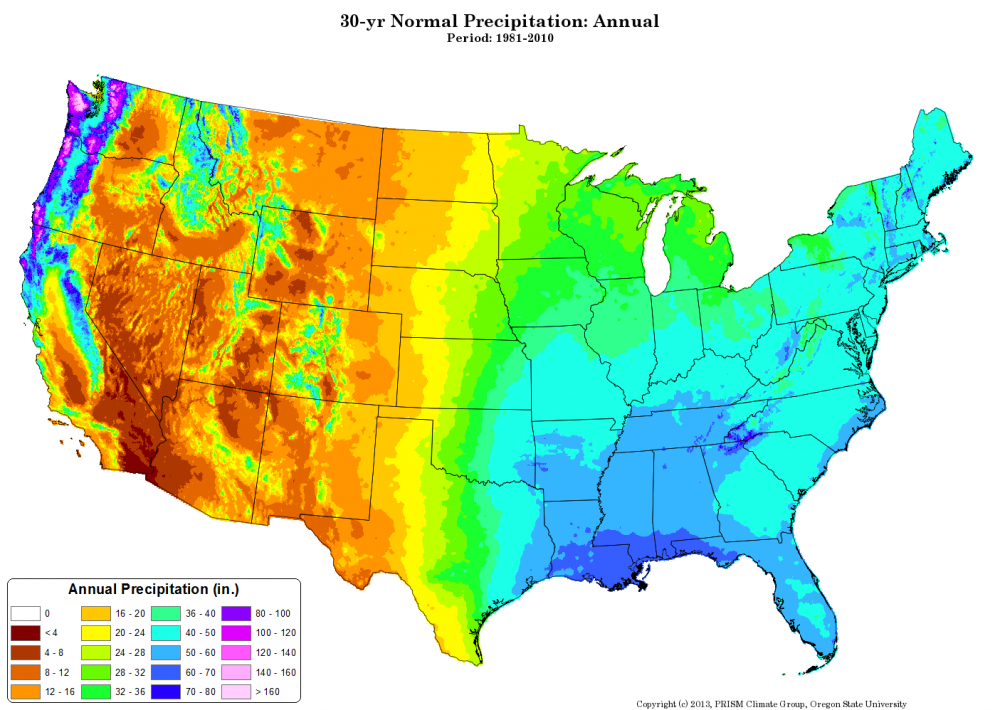
On average the coastline of the Pacific Northwest, on the leeward side of the Cascade Mountains, and the Gulf Coast regions experience the most precipitation in a given year. According to this map from Oregon State University, places around the Cascades and on the West Coast, shaded in pink/purple, averaged over 100 inches of precipitation a year! While the Gulf Coast averages less, between 70-80 inches of rain a year, that region also sees a substantial amount of precipitation annually.
Snowfall totals vary dramatically every year - especially in mountainous areas and downwind of the Great Lakes. The table below is a sample of the snowiest locations in the United States. The information is courtesy of NOAA’s National Center of Environmental Information.
| Location | Annual Snowfall |
|---|---|
| Mount Washington, NH | 283.4 |
| Valdez, AK | 279.4 |
| Blue Canyon, CA | 241.7 |
| Yakutat, AK | 162.1 |
| Sault Ste. Marie, MI | 118.7 |
| Syracuse, NY | 114.7 |
| Caribou, ME | 113.4 |
| Sexton Summit, OR | 99.4 |
| Lander, WY | 97.6 |
| Juneau, AK | 94.3 |
| Buffalo, NY | 91.9 |
| Annual Snowfall over Period of Record | |
It should not be a surprise to see this list dominated by locations in the mountains, Great Lakes and Alaska.
©2024 Association of Certified Meteorologists
All Rights Reserved.