The Hurricane Cone of Confusion
By Craig Setzer, ACM Associate Member
Published: November 14, 2022
Why is the National Hurricane Center’s (NHC) forecast cone so confusing?
A recent study, BAMS-D-21-0250.1.xml published in the Bulletin of the American Meteorological Society in August before Ian struck southwest Florida, indicated that in a survey of over 2,800 residents, almost half thought the NHC forecast cone represented the extent of a storm. And while many of those interviewed are new residents of Florida and have not been through a hurricane threat, many others are lifelong residents who have undoubtedly been exposed to the NHC cone over its 20-year history.
According to the National Hurricane Center, “The cone represents the probable track of the center of a tropical cyclone, and is formed by enclosing the area swept out by a set of circles along the forecast track (at 12, 24, 36 hours, etc). The size of each circle is set so that two-thirds (67%) of historical official forecast errors over a 5-year sample fall within the circle.” In other words, the cone represents where the forecast center point of a storm is expected to be two thirds of the time based on the NHC previous five-year forecast skill. The cone does not change size based on forecast confidence. The cone does not change size based on forecast storm size or intensity. The cone does not show the extent of the storm or any of its potential impacts. The cone does not represent anything other than future points on a map within a probabilistic interval.
Social science research indicates the public relies heavily on the cone to plan and prepare for a storm1. The public believes the cone “is” the storm2. The public believes the cone represents the storm size3. The public believes the cone represents the storm’s intensity. And the public believes the edges of the cone represent the extent of the storm4. Footnotes
Confusion with the cone begins because a storm’s wind swath, the area produced by tropical storm or hurricane conditions, often looks like a cone. This is because strong hurricanes often grow in size and intensity as they evolve and mature. In this case, being in the wind swath likely resulted in you experiencing impacts from Ian.
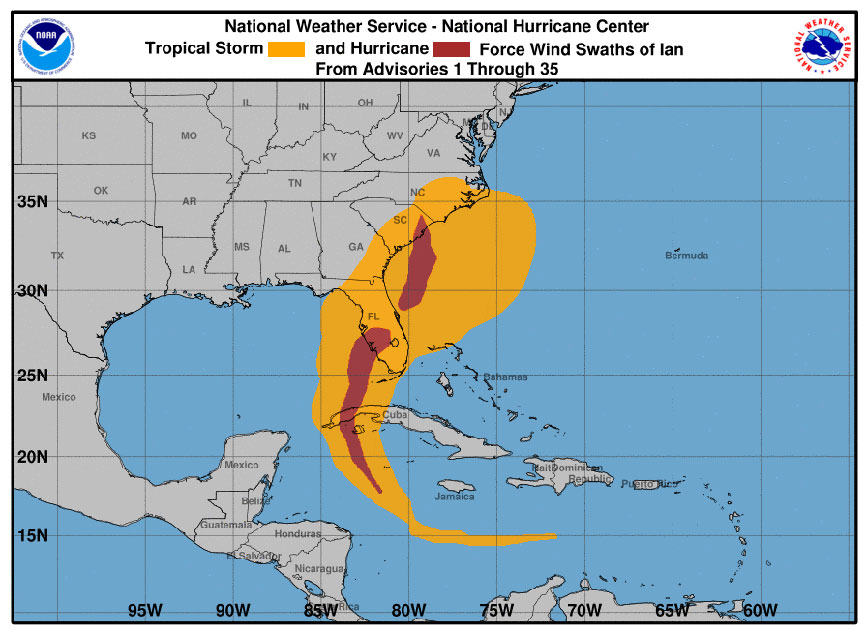
If you lived in the orange area and said you experienced some of Ian’s impacts, you would be correct. Outside of the orange area the impacts are likely less noticeable.
But if you planned for tropical storm (or hurricane) conditions based on being in or out of the forecast cone, you would potentially be making life-threatening mistakes because the forecast cone only addresses a series of forecast points, not any of the storm’s impacts. It says nothing about storm size, intensity, extent of tropical storm or hurricane force winds, storm surge, flooding rainfall, or tornado threat.
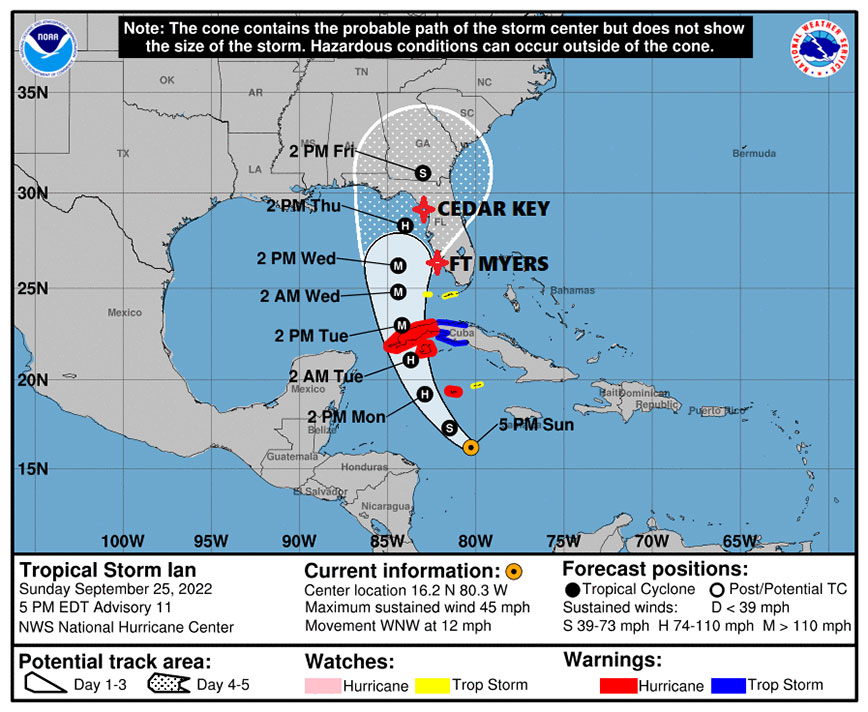
This was especially apparent with Hurricane Ian and the fact that Fort Myers (near the landfall point) remained in the cone, if only on the edge of it, for every advisory. Early indications are that people perceived being on the edge of the cone lowered their risk, and thus they may have delayed or postponed evacuating for storm surge. And while it’s true the landfall point of Ian near Fort Myers was in the forecast cone for each six hourly advisory cycle up to the day before landfall, so was Cedar Key Florida, a point nearly 200 miles away which saw few impacts from Ian.
The NHC cone, when relied upon by the public, often amplifies incorrect storm information within the three-day landfall timeframe, working against preparedness messaging. By its design, the cone gets smaller as you get closer to the storm initialization point. That’s because the odds of a storm wildly deviating from the forecast track is less likely nearer the starting point. By 120 hours (5 days), the storm center point could be up to 200 miles from the forecast track two thirds of the time. But in the first 12 hours, a storm’s center point will stay within 26 miles of the track two-thirds of the time. As a storm center gets closer to a coastal location, the cone has the appearance it is “shrinking” resulting in a public perception of moving “out” of the cone, as a storm approaches. In other words, while a storm’s forecast track may be shifting toward your location, the narrowing of the cone would appear as the risk to your location not increasing, the opposite of what is actually happening.
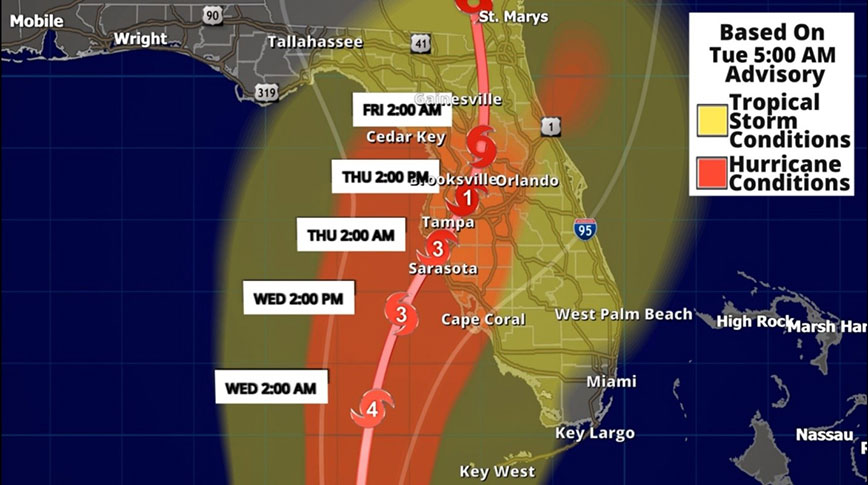
An alternative (below) to the current NHC cone of uncertainty is proposed to include the extent of tropical storm and hurricane conditions. This “threat cone” would be based on the NHC Wind Speed Probabilities product issued each advisory cycle. One advantage is a wind speed probability-based cone would dynamically size based on each forecast advisory, not previous five-year average skill. The size and extent of tropical storm/hurricane conditions would be reflected with each NHC forecast advisory and change when the forecast changed. Additionally, those in the initial tropical storm or hurricane “threat” colored areas would likely investigate the other wind and water hazards as opposed to the legacy NHC cone which breeds “in or out” of the cone thinking and responses.
We’ve had 20 years of testing the NHC forecast cone, and still the public largely misses the message from that graphical tool. The cone is doing what the cone is supposed to do. It is tracking where a point on a map is expected to be two thirds of the time. But a tropical storm or hurricane is much bigger than a one-dimensional point on a map, and the graphical tools we use to warn people should indicate it as such.